要在安装 Chart 之前自定义配置,可以通过 YAML 配置自定义选项。 要想知道有哪些配置可用,可以使用命令 helm show values 查看
$ helm install vault hashicorp/vault --version 0.25.0
NAME: vault
LAST DEPLOYED: Mon Jul 10 14:59:13 2023
NAMESPACE: default
STATUS: deployed
REVISION: 1
NOTES:
Thank you for installing HashiCorp Vault!

Now that you have deployed Vault, you should look over the docs on using
Vault with Kubernetes available here:

https://www.vaultproject.io/docs/


Your release is named vault. To learn more about the release, try:

  $ helm status vault
  $ helm get manifest vault


$ helm install bitnami/mysql --generate-name
NAME: mysql-1612624192
LAST DEPLOYED: Sat Feb  6 16:09:56 2021
NAMESPACE: default
STATUS: deployed
REVISION: 1
TEST SUITE: None
NOTES: ...
查看 Chart 支持的自定义配置选项
## 先查看已安装的 Repo
$ helm repo list
NAME                	URL
eks                 	https://aws.github.io/eks-charts
prometheus-community	https://prometheus-community.github.io/helm-charts

## 查看目标 Repo 中有哪些 Charts
$ helm search repo prometheus-community
NAME                                              	CHART VERSION	APP VERSION	DESCRIPTION
prometheus-community/alertmanager                 	1.33.1       	v0.31.1    	The Alertmanager handles alerts sent by client ...
prometheus-community/alertmanager-snmp-notifier   	2.1.0        	v2.1.0     	The SNMP Notifier handles alerts coming from Pr...
prometheus-community/jiralert                     	1.8.2        	v1.3.0     	A Helm chart for Kubernetes to install jiralert
prometheus-community/kube-prometheus-stack        	82.1.0       	v0.89.0    	kube-prometheus-stack collects Kubernetes manif...
prometheus-community/kube-state-metrics           	7.1.0        	2.18.0     	Install kube-state-metrics to generate and expo...

## 查看目标 Chart 支持哪些自定义配置选项
$ helm show values prometheus-community/kube-prometheus-stack | more
# Default values for kube-prometheus-stack.
# This is a YAML-formatted file.
# Declare variables to be passed into your templates.

## Provide a name in place of kube-prometheus-stack for `app:` labels
##
nameOverride: ""

## Override the deployment namespace
##
namespaceOverride: ""

## Provide a k8s version to auto dashboard import script example: kubeTargetVersionOverride: 1.26.6
##
kubeTargetVersionOverride: ""

## Allow kubeVersion to be overridden while creating the ingress
##
kubeVersionOverride: ""

## Provide a name to substitute for the full names of resources
##
fullnameOverride: ""
...
defaultRules:
  create: true
  rules:
    alertmanager: true
    etcd: true
    configReloaders: true
    general: true
    k8sContainerCpuUsageSecondsTotal: true
    k8sContainerMemoryCache: true
    k8sContainerMemoryRss: true
    k8sContainerMemorySwap: true
    k8sContainerResource: true
    k8sContainerMemoryWorkingSetBytes: true
    k8sPodOwner: true
    kubeApiserverAvailability: true
    kubeApiserverBurnrate: true
    kubeApiserverHistogram: true
    kubeApiserverSlos: true
    kubeControllerManager: true
    kubelet: true
    kubeProxy: true
    kubePrometheusGeneral: true
    kubePrometheusNodeRecording: true
    kubernetesApps: true
    kubernetesResources: true
    kubernetesStorage: true
    kubernetesSystem: true
    kubeSchedulerAlerting: true
    kubeSchedulerRecording: true
    kubeStateMetrics: true
    network: true
    node: true
    nodeExporterAlerting: true
    nodeExporterRecording: true
    prometheus: true
    prometheusOperator: true
    windows: true
...
查看已经安装的 Release 使用了哪些自定义参数,可以使用命令 helm get values <release-name>
$ helm repo ls
NAME          	URL
rancher-stable	https://releases.rancher.com/server-charts/stable
jetstack      	https://charts.jetstack.io
hashicorp     	https://helm.releases.hashicorp.com
查看已安装的 Repo 中可用的 Charts
$ helm search repo hashicorp/vault -l
NAME                            	CHART VERSION	APP VERSION	DESCRIPTION
hashicorp/vault                 	0.25.0       	1.14.0     	Official HashiCorp Vault Chart
hashicorp/vault                 	0.24.1       	1.13.1     	Official HashiCorp Vault Chart
hashicorp/vault                 	0.24.0       	1.13.1     	Official HashiCorp Vault Chart
hashicorp/vault                 	0.23.0       	1.12.1     	Official HashiCorp Vault Chart
hashicorp/vault                 	0.22.1       	1.12.0     	Official HashiCorp Vault Chart
hashicorp/vault                 	0.22.0       	1.11.3     	Official HashiCorp Vault Chart

$ helm search repo
NAME                                              	CHART VERSION	APP VERSION	DESCRIPTION
prometheus-community/alertmanager                 	1.33.1       	v0.31.1    	The Alertmanager handles alerts sent by client ...
prometheus-community/alertmanager-snmp-notifier   	2.1.0        	v2.1.0     	The SNMP Notifier handles alerts coming from Pr...
prometheus-community/jiralert                     	1.8.2        	v1.3.0     	A Helm chart for Kubernetes to install jiralert
prometheus-community/kube-prometheus-stack        	82.2.0       	v0.89.0    	kube-prometheus-stack collects Kubernetes manif...
prometheus-community/kube-state-metrics           	7.1.0        	2.18.0     	Install kube-state-metrics to generate and expo...
prometheus-community/prom-label-proxy             	0.17.2       	v0.12.1    	A proxy that enforces a given label in a given ...
prometheus-community/prometheus                   	28.9.1       	v3.9.1     	Prometheus is a monitoring system and time seri...
prometheus-community/prometheus-adapter           	5.3.0        	v0.12.0    	A Helm chart for k8s prometheus adapter
$ helm search hub wordpress
URL                                                 CHART VERSION APP VERSION DESCRIPTION
https://hub.helm.sh/charts/bitnami/wordpress        7.6.7         5.2.4       Web publishing platform for building blogs and ...
https://hub.helm.sh/charts/presslabs/wordpress-...  v0.6.3        v0.6.3      Presslabs WordPress Operator Helm Chart
https://hub.helm.sh/charts/presslabs/wordpress-...  v0.7.1        v0.7.1      A Helm chart for deploying a WordPress site on ...
$ helm list -A NAME NAMESPACE REVISION UPDATED STATUS CHART APP VERSION aws-load-balancer-controller kube-system 1 2026-02-17 15:47:38.190164778 +0800 HKT deployed aws-load-balancer-controller-3.0.0 v3.0.0 eks-monitor monitoring 14 2026-02-21 02:23:09.462138692 +0000 UTC deployed kube-prometheus-stack-82.2.0 v0.89.0 $ helm status eks-monitor -n monitoring NAME: eks-monitor LAST DEPLOYED: Sat Feb 21 02:23:09 2026 NAMESPACE: monitoring STATUS: deployed REVISION: 14 TEST SUITE: None NOTES: kube-prometheus-stack has been installed. Check its status by running: kubectl --namespace monitoring get pods -l "release=eks-monitor"
Visit https://github.com/prometheus-operator/kube-prometheus for instructions on how to create & configure Alertmanager and Prometheus instances using the Operator. $ helm status aws-load-balancer-controller -n kube-system NAME: aws-load-balancer-controller LAST DEPLOYED: Tue Feb 17 15:47:38 2026 NAMESPACE: kube-system STATUS: deployed REVISION: 1 TEST SUITE: None NOTES: AWS Load Balancer controller installed!
查看 Chart 的具体信息
使用命令 helm show chart 或则 helm show all 查看 Chart 详细信息,里面包含了关于 Chart 配置的详细信息和结构。
Confluence 的用户附件、索引、插件配置等都存储在 Home 目录下。进入旧服务器的映射目录,执行
tar -zcvf confluence_home_backup.tar.gz /path/to/old/confluence_home
将备份文件传输到新 Confluence 环境 Home 目录并解压
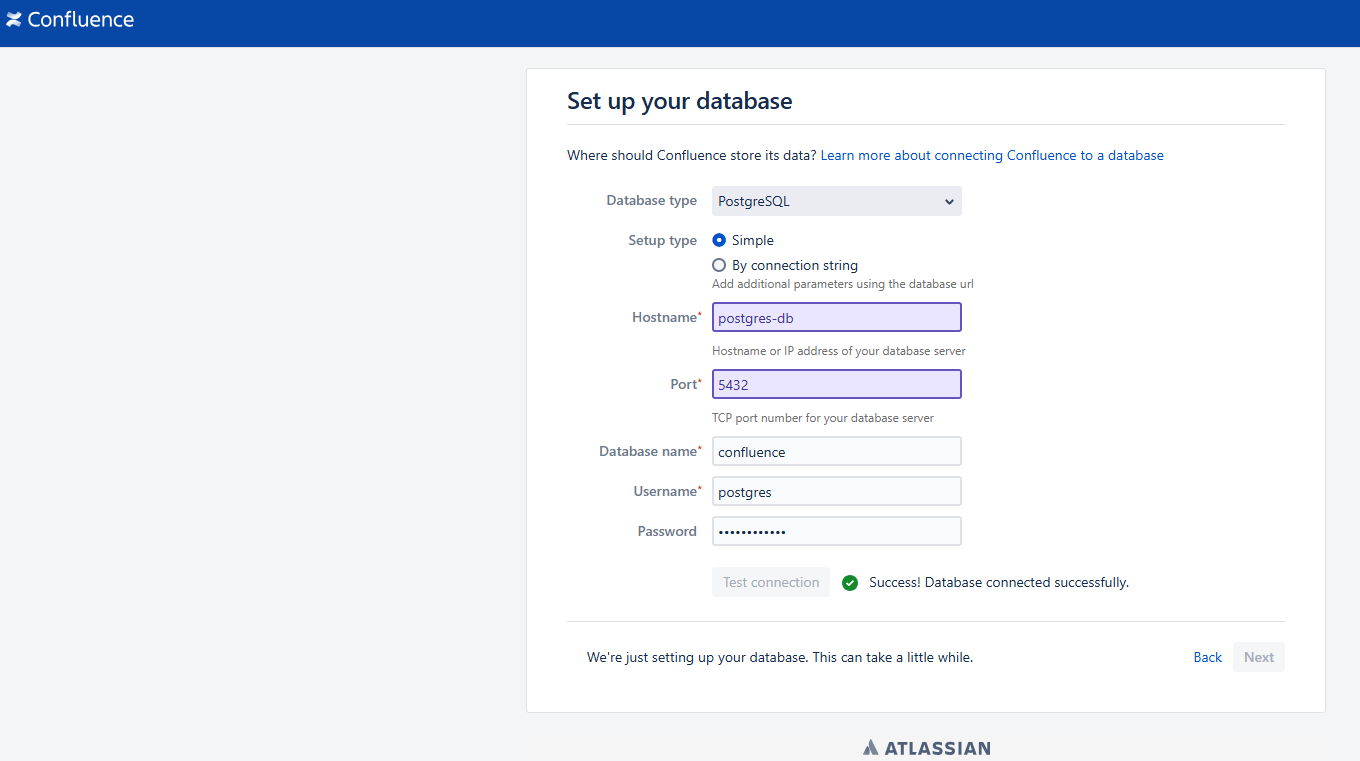
修改配置文件(如果数据库连接变了)
如果新环境的数据库 IP、端口或密码与旧环境不同,你需要修改新环境 Home 目录下的配置文件:
文件路径: <confluence-home>/confluence.cfg.xml
迁移完成后,重启 Confluence,即可加载到旧环境中的数据。
常见问题
迁移后文档无法编辑
迁移完成后,Confluence 打开正常,数据已经恢复,但是编辑文档保存时报错: Something went wrong after loading the editor. Copy your unsaved changes and refresh the page to keep editing.
$ kubeadm token list
TOKEN                     TTL         EXPIRES                USAGES                   DESCRIPTION                                                EXTRA GROUPS
8ca35s.butdpihinkdczvqb   19h         2022-09-14T02:54:55Z   authentication,signing   The default bootstrap token generated by 'kubeadm init'.   system:bootstrappers:kubeadm:default-node-token
--server-side 选项用于解决可能的报错: The CustomResourceDefinition "applicationsets.argoproj.io" is invalid: metadata.annotations: Too long: may not be more than 262144 bytes
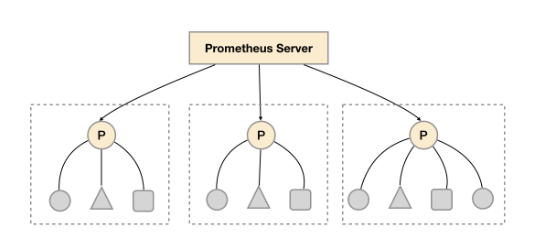
创建 Prometheus Server 配置文件,如 /root/prometheus/prometheus.yml,内容如下 [1]
/data/prometheus/prometheus.yml
# my global config
global:
  scrape_interval:     15s # Set the scrape interval to every 15 seconds. Default is every 1 minute.
  evaluation_interval: 15s # Evaluate rules every 15 seconds. The default is every 1 minute.
  # scrape_timeout is set to the global default (10s).

# Alertmanager configuration
alerting:
  alertmanagers:
  - static_configs:
    - targets:
      # - alertmanager:9093

# Load rules once and periodically evaluate them according to the global 'evaluation_interval'.
rule_files:
  # - "first_rules.yml"
  # - "second_rules.yml"

# A scrape configuration containing exactly one endpoint to scrape:
# Here it's Prometheus itself.
scrape_configs:
  # The job name is added as a label `job=<job_name>` to any timeseries scraped from this config.
  - job_name: 'prometheus'

    # metrics_path defaults to '/metrics'
    # scheme defaults to 'http'.

    static_configs:
    - targets: ['localhost:9090']
使用 Docker 启动时挂载此文件,作为 Prometheus Server 的配置文件,之后需要修改配置,可以直接修改此文件。